Creates different kind of plots for variables within a dataset using ggplot2
Source:R/plot_vars.r
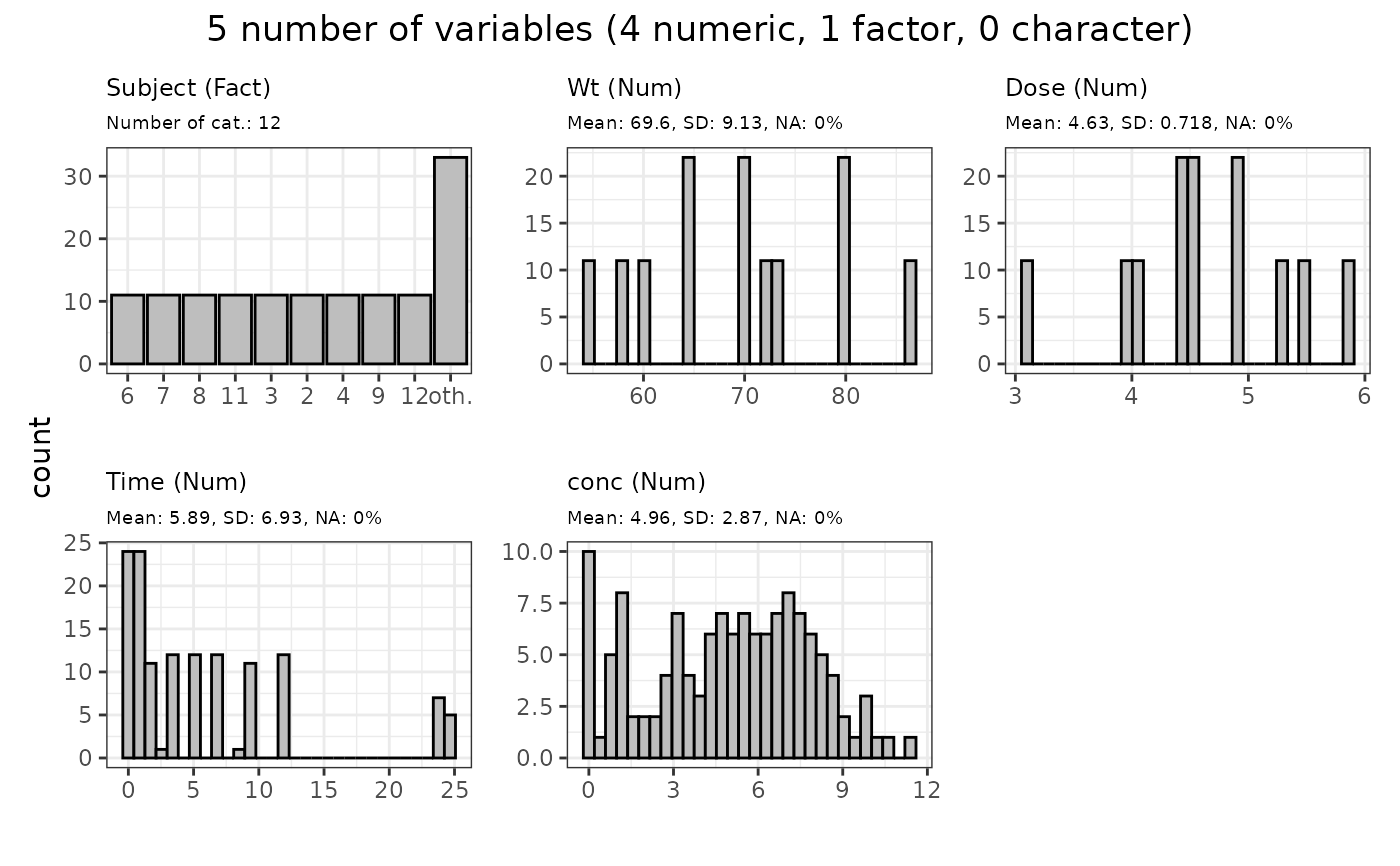
plot_vars.RdThis function creates histograms for numeric values and barcharts for character or factor variables In case there are more then 10 unique values it will list the first 10 unique values in a 'text' plot
Usage
plot_vars(dfrm, vars = names(dfrm), ppp = 16, ...)Arguments
- dfrm
data frame that should be plotted
- vars
character vector with the variables for which plots should be generated
- ppp
number plots per page
- ...
additional arguments passed to
patchwork::wrap_plots()(e.g. ncol/nrow)